Catholic and Protestant QUB staff on course to be eclipsed by those of neither religion


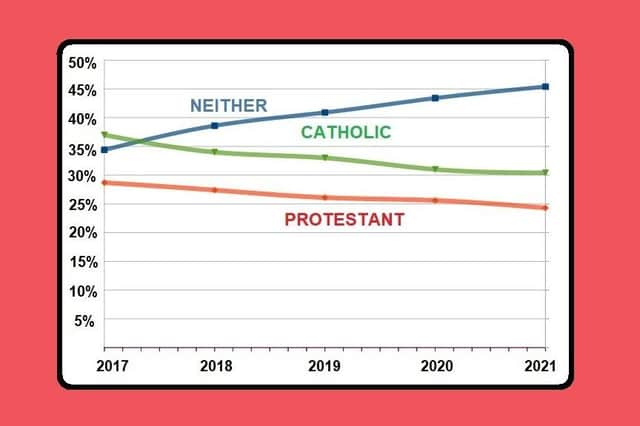
At present 45.4% of staff fall into the “neither” category, whilst 30.4% are from Catholic backgrounds, and 24.3% are from Protestant ones.
The trajectories of all three groups don’t change much with each passing year, indicating this is a long-term picture.
Advertisement
Hide AdAdvertisement
Hide AdThis means if things continue along the same track for another five years, then by 2026 a whopping 56.4% of Queen’s staff would be “neither”, whilst Catholic staff would have fallen to 23.8% and Protestants to 19.9%.
This is rather out-of-kilter with the general population.
Here are the results from the last census of Northern Ireland in 2011, when people were asked to state their religion:
> 41.6% Protestant
> 40.8% Catholic
> 17.7% neither/ unknown
It’s not totally clear whether the large number of non-Catholic, non-Protestant staff is down to academics being less inclined to identify themselves with religion than the general public, or because many staff are from overseas – or both.
The News Letter decided to look into the matter after the Belfast Telegraph published some figures on religious background earlier in the week.
Advertisement
Hide AdAdvertisement
Hide AdThe data obtained by the News Letter gives more of an indication of the long term trends, with figures for all three Queen’s departments spanning the past five years – from 2017 to 2021.
It also breaks down the religious backgrounds of teaching and research staff in all three Queen’s departments:
Arts, English & Language:
> 2017:
Protestant: 26.9%
Catholic: 42.3%
Neither: 30.8%
> 2021:
Protestant: 22.4%
Catholic: 35.4%
Neither: 42.1%
Medicine and Life Science:
> 2017:
Protestant: 34.8%
Catholic: 38.7%
Neither: 26.5%
> 2021:
Protestant: 27.2%
Catholic: 31.1%
Neither: 41.7%
Engineering and Physical Sciences:
> 2017:
Protestant: 23%
Catholic: 31.1%
Neither: 45.9%
> 2021:
Protestant: 21.7%
Catholic: 25.2%
Neither: 53%
More from this reporter:
Click here: Whopping 94.2% of students in Holylands are Catholic – with sectarian divide branded ‘depressing’
——— ———
A message from the Editor:
Advertisement
Hide AdAdvertisement
Hide AdThank you for reading this story on our website. While I have your attention, I also have an important request to make of you.
With the coronavirus lockdowns having had a major impact on many of our advertisers — and consequently the revenue we receive — we are more reliant than ever on you taking out a digital subscription.
Subscribe to newsletter.co.uk and enjoy unlimited access to the best Northern Ireland and UK news and information online and on our app. With a digital subscription, you can read more than 5 articles, see fewer ads, enjoy faster load times, and get access to exclusive newsletters and content.
Visit
now to sign up.
Our journalism costs money and we rely on advertising, print and digital revenues to help to support them. By supporting us, we are able to support you in providing trusted, fact-checked content for this website.
Ben Lowry, Editor