Catholic population set to dwarf Protestants in years ahead


An analysis of the Province's religious make-up reveals the extent to which Catholic numbers have steadily-but-relentlessly risen since partition, while Protestant ones have shrunk.
And looking at what the future has in store, almost half of children aged four-or-under are being raised Catholic, while those being raised Protestant make up little over a third (see chart).
Advertisement
Hide AdAdvertisement
Hide AdWith unionists mulling the future of the Province's link to Great Britain after the election (leaving an Assembly that is 44% unionist, 43% nationalist, and 12% neither), the figures paint a stark picture of a historic trend which is may work against them '“ unless they can win Catholic support.
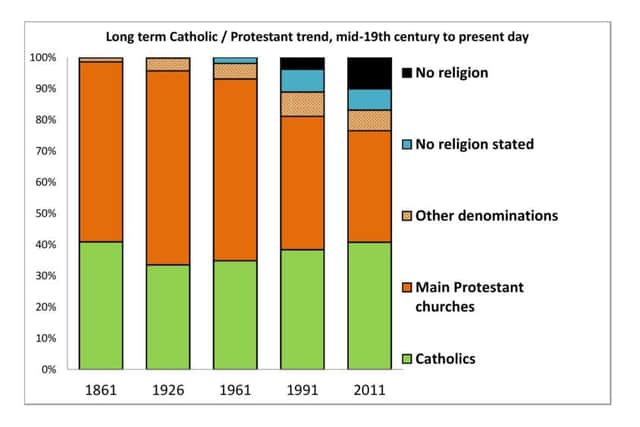
The News Letter has pored over figures dating back to when religious census records first began in 1861, covering the six counties which now make up Northern Ireland.
The proprtion of Catholics was at its highest recorded peak at that time, but then went in to decades of decline.
But ever since the island of Ireland was partitioned the proportion of Catholic people in the Province has been rebounding, and is now virtually back to its 1861 zenith.
The figures are as follows:
1861: 40.9%
1926: 33.5%
1961: 34.9%
1991: 38.4%
2001: 40.3%
2011: 40.8%
Advertisement
Hide AdAdvertisement
Hide AdMeanwhile, the proportion of Protestants has never been so low '“ and is getting lower still.
Whilst religious persuasion offers no guarantee of political preference, the News Letter has also examined data showing the extent to which Protestants and Catholics still just vote along unionist and nationalist lines.
After the 2011 census, the NI Statistics Agency produced a Province-wide map showing what religion people were, or had been raised in.
Advertisement
Hide AdAdvertisement
Hide AdWhen this is compared against a map of the last general election results, the picture is plain.
In places where Protestants (or those with Protestant backgrounds) outnumbered their Catholic counterparts even slightly, unionist MPs were elected '“ and vice-versa with nationalists '“ in all but two of the 18 constituencies.
The only exceptions to this headcount-style rule were North Belfast (where the community divide is so close elections could go either way) and Catholic-dominated Fermanagh & South Tyrone (where the UUP and DUP had agreed a pact to stand just one candidate between them).
Understanding Northern Ireland's Protestant decline begins with the 1926 census '“ the first such assessment of the population after partition.
Advertisement
Hide AdAdvertisement
Hide AdIt revealed that whilst 33.5% of people in the new state were Catholics, 62.2% belonged to the main trio of Protestant churches - namely, Presbyterians, Anglicans, and Methodists.
Another 4.1% belonged to other Christian denominations, the bulk of which were also Protestant.
This picture changed only slightly between then and the middle of the 20th century.
Census figures in 1971 and 1981 appear somewhat unreliable due to disruption from the Troubles, but they began resuming a more-or-less normal pattern in 1991.
Advertisement
Hide AdAdvertisement
Hide AdThat year it became clear that a tipping point had been reached '“ the outright Protestant majority had been lost.
While the proportion of Catholics had risen to 38.4%, those belonging to the main three Protestant churches had dipped to 42.8%, and other denominations accounted for 7.8%. Meanwhile 7.3% did not state any religion, and 3.7% said that they did not have one.
By the time of the last census in 2011, 40.8% of the population were Catholic, 35.8% were in the main three Protestant churches, and 6.6% belonged to other denominations or faith (made up of 5.8% Christian-related groups, and 0.8% non Christian-related). Meanwhile 6.8% did not declare a religion, and 10.1% expressly said they had none.
And looking to the future, the chart covering the backgrounds of children aged four-and-under reveals that Catholics (49.2%) utterly outnumber Protestants (36.4%) '“ and another 14.3% of these children are now in neither bloc (see below for more on this).
Advertisement
Hide AdAdvertisement
Hide AdTHE RISE OF THOSE WITH NO FAITH:
Two groups of people who barely existed on the 1926 census have now grown to be quite significant blocs of the population.
At that stage of history, almost nobody said they had no religion, and almost no-one declined to state one.
For instance, out of a population of 1.26 million (as opposed to more than 1.8 million now) there were just 37 recorded atheists '“ 0.003% of the population. Just 0.2% of people did not state a religion.
Advertisement
Hide AdAdvertisement
Hide AdBy 1961, 2% of respondents were not stating a religion on their census forms, although the numbers of atheists remained low at just 87.
But in 1991, 7.3% of people did not state a religion on their census forms '“ and, what is more, for the first time a significant number of people began to emerge explicitly rejected religion(as opposed to simply not stating one).
In that census, 59,234 wrote 'none' when asked their religion '“ amounting to 3.7% of the population.
This sudden rise could be down to the manner in which statistics were recorded; for example, in preceding decades there appears to have been no category marked '˜none' in the census figures.
Advertisement
Hide AdAdvertisement
Hide AdIn the last census, 10.1% (183,164 people) said they had no religion, and 6.8% (122,252) did not state a faith.
More revealing still are the figures behind the chart covering those aged four-and-under.
The census data shows that 0.9% of such children (1,225) were being brought up in non-Christian faiths, whilst 13.4% (16,692) were being brought up by people who filled in 'none' in the religion section of the census form.
NUMBER OF PROTESTANTS IS TRICKY FIGURE:
Measuring Northern Ireland's entire population every 10 years is a mammoth task, and gauging religion is particularly tricky. When it comes to how people are surveyed, the census compiles two sets of figures: firstly what religion people are, and secondly what religion they are or were brought up in.
Advertisement
Hide AdAdvertisement
Hide AdThe figures here stem from the first set of data unless otherwise stated, like with those relating to children aged four-and-under.
In the first set of data, Protestant in essence means the three big churches, but giving an accurate figure for Protestants overall is hard since there is a constellation of non-Catholic denominations, which are categorised '˜other denomination' with Muslims and others. Not all would embrace the label '˜Protestant'.
In the 2011 census there were 67 individually-named Christian-related groups, with Baptists (18,513 people), Pentecostals (12,438), Free Presbyterians (10,068) and Brethren (6,776) among the largest. The numbers of non-Christians remained tiny; the most numerous group were Muslims (3,832).