
Census data for Ballymena flashpoint shows the majority of the population arrived in a decade - and employment is high
Over half the population in the part of Ballymena blighted by violence over the past week arrived here between 2011 and 2021 – with employment much higher and economic inactivity much lower than elsewhere, according to census data.
The Clonavon area of the town has a far higher concentration of migrants than Ballymena as a whole, which itself has higher figures than Northern Ireland generally.

Data also reveals that a majority of people in the area weren’t born in Northern Ireland, and don’t speak English as their main language.
While generally there has been a gradual increase in the proportion of people not born here, the figure in this area is much higher.
While the area has a higher than average proportion of people in low-paid work – and a majority with no qualifications at all – there are higher employment levels and fewer people deemed economically inactive than across the province.
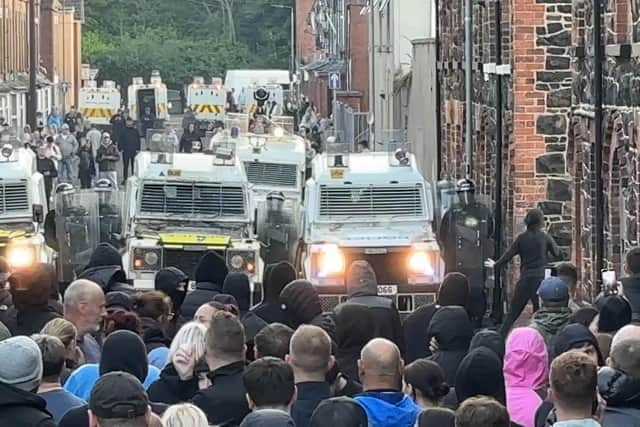
Last week, houses of minority groups were vandalised and set alight in what the PSNI called “racist thuggery” after a peaceful protest sparked by an alleged sexual assault on a child in the town.
It has led to concerns being expressed by local politicians about “demographic change” in the area – claims supported by figures in the most recent census. People born in Northern Ireland are a minority in the ‘G3’ area in which trouble flared according to data from the 2021 census.
The rate of change in the area has been rapid – with 52% of those registered in the census arriving in the previous decade. However, that data will not take into account illegal migration – and only covers the period up to 2021.
The area’s MP has said that illegal immigration had been a problem in the town – a statement Justice Minister Naomi Long said he “had no way of proving”.
The TUV leader has also highlighted concerns about the “concentration” of members of the Roma community in the area, which he said had been caused by people crossing the border with the Republic, where they are entitled to move freely within the EU.
At the weekend, the News Letter revealed that the Home Office is conducting a major criminal investigation into what they suspect is organised crime gang, believed to be trafficking Roma people into Northern Ireland, with evidence uncovered of potential fraud relating to post-Brexit immigration rules.
Many of the immigrants into Ballymena in recent years work in jobs employers say they can’t fill locally.
The scale of illegal immigration is, by its nature, hard to quantify. However, official data shows that by 2021 the small number of streets most affected by the violence has a far higher concentration of legal migrants than Northern Ireland as a whole.
Only 38% of people there were born in NI, with 57% from outside the UK and Ireland.
A majority, 53%, hold passports from countries outside the UK and Ireland – compared to just 5% in NI.
Sixty-four pre cent of people in the area identify as nationalities other than British, Irish or Northern Irish – compared to just 7% in NI.
A majority of people have languages other than English as their main language (56%), compared to 5% generally, with only 44% using English as their first language - compared to 95% across the province.
Sixty-three per cent are white, compared to 97% of the NI population, with other ethnic groups at 37%, compared to 3% in NI.
According to the 2021 census – the town as a whole has the same ethnic balance as the rest of NI – 97% white. However, figures on nationality and the first language of residents shows disproportionately high numbers of foreign nationals compared with the NI figures.
Almost four out of five people in Ballymena (78%) were born in NI, compared to 87% in NI as a whole. In the Clonavon area, 3% of those not born here arrived before 2001, another 6% arrived between 2001 – 2010. After this, numbers spiked – with 52% of the population arriving in the following decade.
There is a mixed picture economically, according to the data. Employment rates are much higher than NI as a whole – with the number of people deemed “economically inactive” much lower. This includes people who are sick or disabled, students, those looking after a home or those who retired early.
Sixty-nine per cent of residents are employed, compared to 56% in NI. Economically inactive residents make up just 26% – compared to the NI rate of 41%.
The jobs are largely in low-paid industries, with over half the population classed as working as 'process, plant and machine operatives’ (25% compared to 8% in NI), or ‘elementary occupations’ (26% against NI average of 10%).
Strain on housing shows in the census data. Fifty-seven per cent of properties in this area are in the private rented sector – compared to 17% regionally.
In terms of families, 23% of people are classified as living in 'other household types' – such as HMOs – compared to just 6% in NI. The rest are one-person households or various classifications of families.
A majority (54%) don't have private transport, compared to just 20% in NI generally. The majority of the area’s population is single – 54%, compared to 38% in NI and 54% are male.
The G3 area covered by the Nisra data had a population of 785, with 261 households.